Excellerate Services promotes itself as a ‘data-led and dynamically driven’ provider of cleaning and security services to a broad range of clients in the private and public sector. But how exactly does data lead our approach to cleaning?
Nick Rastelli, Excellerate’s Group Sales & Marketing Director unpacks the key elements of our data-led approach, providing some clarity on how it has allowed the business to deliver enhanced service, motivate staff and deliver commercial benefit to clients.
Capturing Data v Effectively Analysing to a Client’s Benefit
Since coming into the industry over 16 years ago (and don’t I feel old writing that) there has been constant talk about using data to define how service should be delivered. Our market-wide conversations show that whilst there are many cleaning companies and clients capturing information and data, there is a lack of understanding of the information being captured and how to effectively use it to enhance service or value.
What Clients Want
The accepted stance seems to be that we are no longer able to rely on arbitrary, BICSc-related cleaning methodologies (and I’m not having a dig at BICSc; they deliver outstanding work) or the ‘time and motion studies’ that underpin so many solutions. Clients want us to use data that has a real-time, day-to-day impact on our approach. By doing so, we can truly provide our clients and site users with the cleaning service that they need – and not what an uncultured, decade-old SLA might call for.
But what is data-led cleaning and what is the impact data could have on the cleaning standards and costs in your workspace?
Start with the Washroom
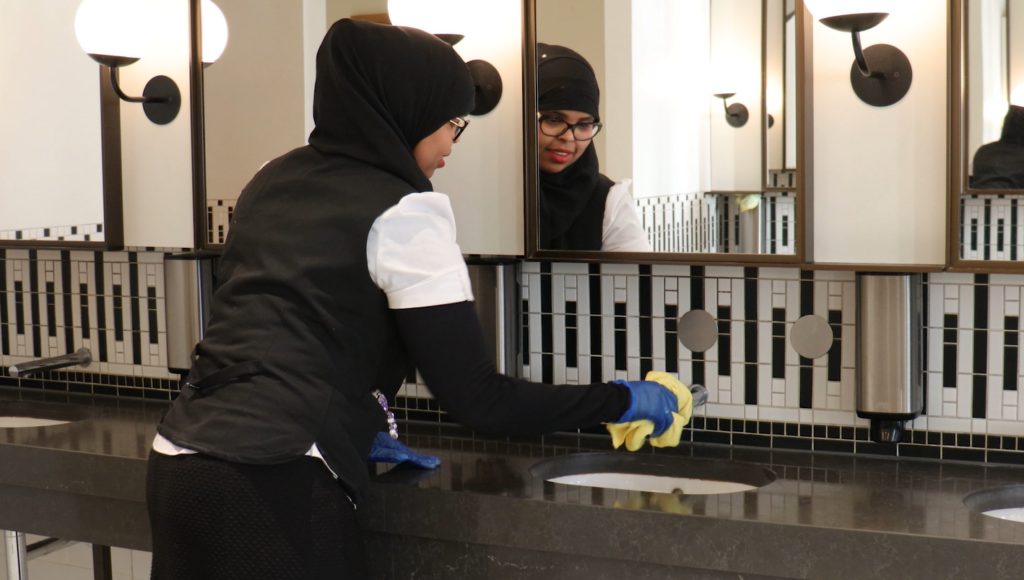
The obvious place to start is to understand how a space is used and when cleaning should occur. Washrooms are a fantastic example of an environment that is regularly used and can be highly emotive should standards not meet expectations.
Furthermore, using the washroom as the base example of how a data-led clean can have a positive impact, we can extrapolate this micro
scenario out across all areas of a site.
Is the 3-Time Clean Now Redundant?
Typically, it might be expected that washrooms are heavily used three times per day and an effective cleaning approach is to clean them after each ‘use’ period. In a flexible workspace world, with employees potentially working longer or a reduced number of days in an office, the three-time clean is now redundant. The redundancy is further applied when the washroom is within a 24/7 environment where the three-time use has never existed, and a variety of cleaning approaches take precedence.
Already, it’s easy to see how important it is to monitor real-time occupancy and usage and proactively respond to these trigger points to deliver an effective clean.
By doing so, cleaning colleagues don’t need to put up the ‘No Entry’ sign, when they happen to clean during the most inopportune moments but deliver the cleaning approach the site needs.
But how do we know if the clean has been effective, even if we deliver the clean that is needed based on usage?
Real-Time User Sentiment is THE Key Data Point
Well, we do through real-time sentiment and understanding of the user experience. It can be argued that this should actually be the only data point that matters where cleaning is concerned.
Should we not solely focus on making sure our teams present the environment to the standard that our stakeholders demand? And if we’re using sentiment, we can also move away from the clean on use approach because driving a cleaning operation from sentiment means that we will only ever present the environment to the standards expected.
AI is Your Friend
Realistically in a busy environment, we’re not going to be able to clean once per day, or less. Sentiment capture will confirm standards but even in real-time, we are still reactively understanding when service needs to happen.
So here comes our good friend AI and the proactive, objective support it provides.
A Bespoke ‘What Good Looks Like’ Ethos
Using a bespoke site ‘what good looks like’ ethos and capturing complementary imagery, we can provide immediate feedback to our cleaning teams on whether the clean provided is to the standard needed. This means each team won’t need to
wait for the next occupancy trigger or the next sentiment score to be returned; they’ll have absolute clarity on the quality of output instantly.
Using AI, over time, will provide a bank of what good looks like images that can be analysed against daily usage and sentiment scores. This provides the basis to really understand how bespoke usage and culture, in any environment, has an impact on cleanliness standards.
So this all sounds great and when extrapolated across various environments provides an understanding of a site’s usage in a way we have never understood before.
Visibility of Data
When clients and cleaning management teams have the same visibility of the data – both site users input and cleaning teams service output – it makes for a unique situation where everyone knows exactly how the service is performing. It even means we can all get on that continuous improvement wheel that, I believe, we all want to be on but don’t really know how to start pedalling forward. And what is better than presenting data in an easy-to-understand, bespoke dashboard that enables the contractor and the client’s management team to have absolute visibility to the underlying rationale to the service delivery?
Now the cost of getting to this point could be a barrier to entry. Well, there are lots of fantastic systems out there that are chargeable and can be prohibitive. There are also systems out there that are possibly more advanced and certainly more integrated and maybe don’t cost very much at all. But I’m not here to sell Velocity, the system is more than capable of doing that on its own!
(And if you are interested in finding out more, why not book a Velocity demo!)